Workflow of our HORIBA TestWork Automation Software
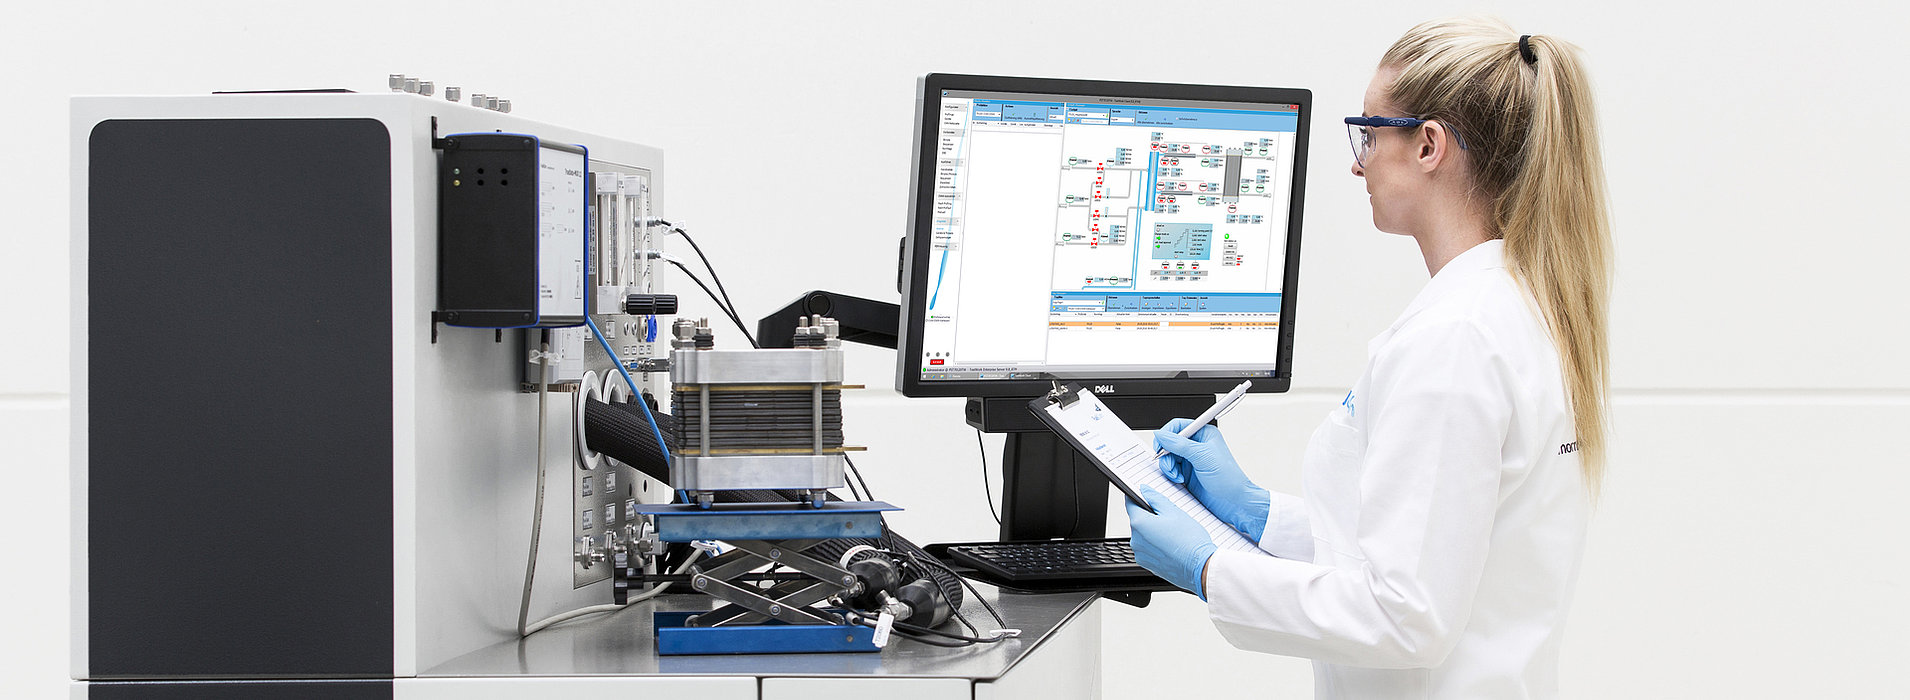
Our HORIBA TestWork automation software not only is highly effective and extensive but it is especially designed according to the latest software ergonomics. The graphical user interface was developed together with users and is thus oriented towards the requirements of daily use. Furthermore, HORIBA TestWork is characterized by a clear and logically comprehensible appearance that significantly facilitates intuitive control. For enhanced visualization, HORIBA TestWork is optimized for visualization on two screens.
Central element of operation is the navigation vertically arranged on the left pane of the main window. The navigation is oriented towards the procedure of a typical test run. The displayed tools can be adjusted specifically to the user. However, they always remain logically grouped in the structure according to the division into Configure, Prepare, Execute and Evaluate. Not used menu items can be hidden within the navigation bar.
In terms of the tools available, HORIBA TestWork is also oriented towards the procedure of a test run and roughly differentiates tools between Designers (for configuration/preparation) as well as Managers (for execution/evaluation). Due to the extensive settings options, the individual tools can be arranged arbitrarily and configured customer-specifically.
A further component of navigation is the emphasis “Diagnosis” that, amongst others, includes the visualization of the current test station alarm status. Alarms correspond to firmly defined system limits that either indicate a disturbance or initiate defined actions in case of exceeding or falling below the concerned limit. Depending on the alarm status, the navigation bar is either colored blue-gray (no alarm), yellow (Alarm 2) or red (Alarm 3).
Execute
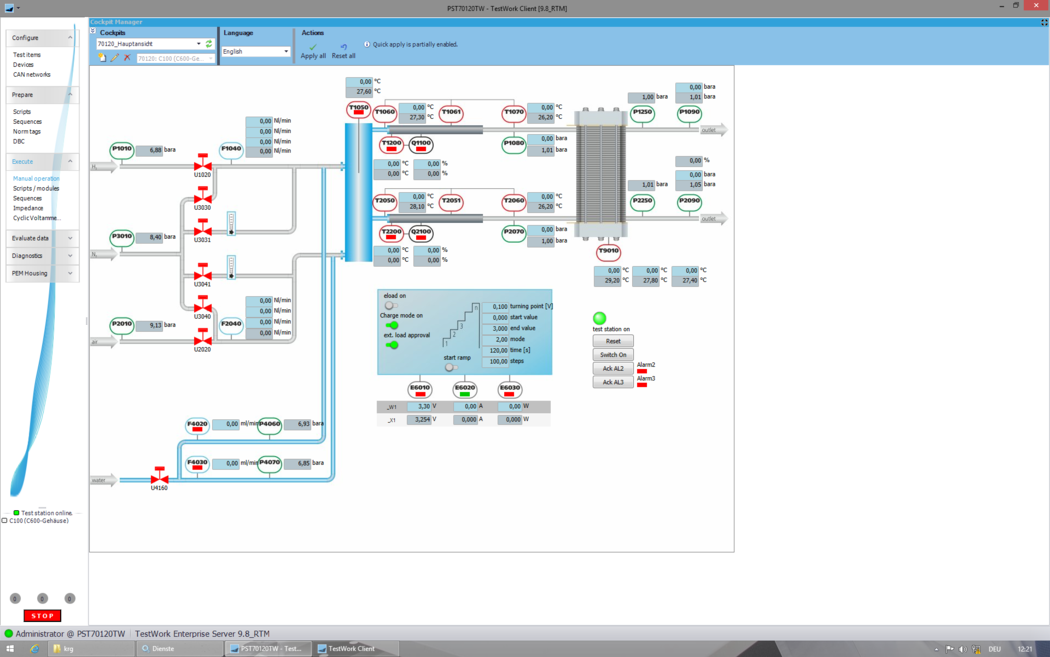
Test run execution in HORIBA TestWork can be carried out in a manual, partly automated and fully automated way. Doing so, the operator has manifold control options optimally adjusting to the test requirements. Extensive long-term tests in particular can be realized easily and safely. Independent from the test run type, the parameters are automatically applied from the test item database and are loaded to the preview when selecting the test item. That way, the parameters can be aligned with the test run conditions and adjusted, if applicable. In favor of a better differentiation of test runs, it is possible to optionally provide test runs with a customer-specific denomination that facilitate filtering by test run information in the follow-up.
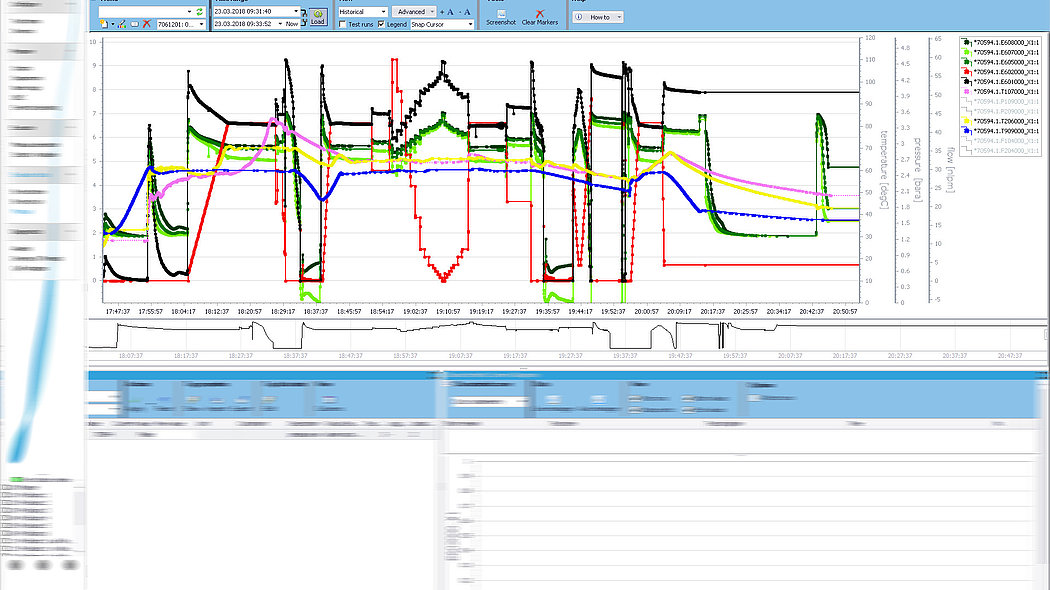
The operator can observe the test run live in the Script Monitor or Sequence Monitor, in the Cockpit or in the Trend. Even with fully automated tests, the operator can manually intervene without problems and without having to terminate the test run. During a test run, the export of data is possible as well. In addition, HORIBA TestWork plots characteristic curves live and thus makes them instantly available. Countless options for the operator in terms of individual test run design result from the high-performance tools.
Evaluate
In the last step, the test run evaluation is carried out by means of the HORIBA TestWork software. All data is logged in an SQL database whereby HORIBA TestWork differentiates between process log database, alarm log database, configuration database and characteristic curve database. These databases are physically separated from each other and thus provide for even higher performance.
Data collection is primarily carried out by the real-time controller. This controller records the data, creates a timestamp and pushes the data through the Windows level for being logged to the SQL database. Each real-time controller also disposes of a sufficiently large buffer storage that temporarily logs data until the successful transfer to the SQL database.
In the evaluation, test runs can be filtered by diverse parameters, as for example by test item, test type or creator. The visualization of the selected test run is carried out in the high-performance HORIBA TestWork Trend. Here, it is possible to zoom, modify time ranges, more exactly observe switching thresholds or define the section to be exported. As well, HORIBA TestWork supports the creation of arbitrary characteristic curves by user-defined diagram types. The data export from the SQL database is realized by the Export Manager and is possible in diverse file formats. These include, amongst others, XML, XLS, XLSX, CSV or MDF.